Live Audio Visualization With Rust in a GUI Window
In early 2021 I had a closer look into several aspects of digital signal processing (DSP), including lowpass filters, frequency spectrum analysis, and audio visualization. I used Rust to experiment with this. The Rust ecosystem didn’t offer simple-to-use libraries for my use cases back then, or at least they were not easy to find. While I learned more about the topic, I created multiple crates, with the hope they may be helpful to other developers in the same field. So far I’m the creator and maintainer of four different crates related to DSP/audio:
In this blog post, I’d like to talk about the latest changes of audio-visualizer. My goal with this crate is to empower developers of audio algorithms (lowpass, spectrum analysis, beat detection, …) to easily plot audio. The audio may come from the microphone or an MP3. These visualizations include waveforms, frequency spectrums, and (*new*) a GUI window with live audio data + changes to the audio after processing it.
To create very nice visualizations for end-users is not a goal, although I’m not against it. Code contributions are very welcome! I don’t have much experience with (nice and beautiful) computer graphics, therefore functionality was more important to me than nice graphics in this specific regard.
Anyway, let’s take a closer look at my latest feature. It looks like in the video below:
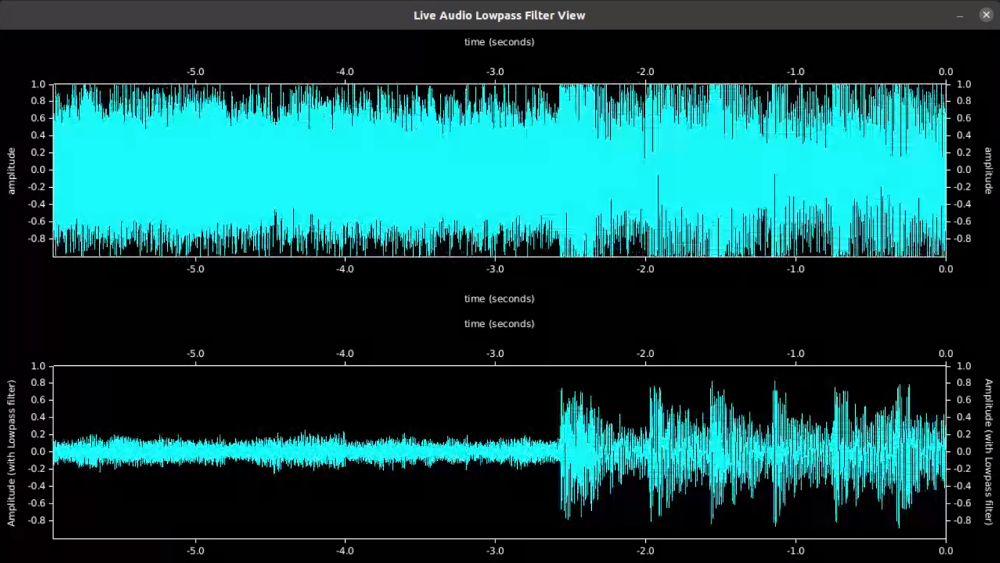
The idea is that on the top you can see the latest 6 seconds of audio data. You can attach an audio input device from cpal to it, such as the microphone. The diagram on the bottom is configurable. A programmer may specify a closure, that transforms the original audio data to the desired format, such as putting the data through a lowpass filter or a frequency spectrum analysis. The example above shows the waveform of the song Holiday by Green Day. The bottom shows the lowpassed audio data. You can clearly see when the drums kick in (second half of the video). The source code of this example is available on Github.
The next video demonstrates a live frequency spectrum analysis of the same song. It is easily noticeable, that the low frequencies (beat/drums) are very present.
Because of the lack of experience with drawing GUIs, the animation is not perfectly smooth, although it is much better than in the video. But I’m proud of what I achieved: a library function, that is easy to use for everyone and helps to make fast progress, when developing audio algorithms. For example, with the visualization, I could compare my lowpass filter-crate (first-order filter) with the biquad-crate (second-order filters) and come to the conclusion, that a digital biquad filter offers better results than my lowpass filter (with a little bit higher computational costs).
Last but not least, I just think it’s really cool, what I have programmed there! This was my first time working with GUIs in Rust. I use minifb as a cross-platform Window library and plotters to draw the diagrams. Plotters draws the diagrams into a bitmap and minifb uses the bitmap as content for the GUI. So far so good. Unfortunately, the performance is not optimal, because at each animation step I draw the whole diagram again (a few hundred thousand of data points). I experimented with down-sampling the data, but the result was not satisfiying. So… code contributions are always welcome. Still I’m proud on this, because it is extremely helpful and I learned of course as always a lot.
I hope it may be helpful to some of you aswell.
0 Comments