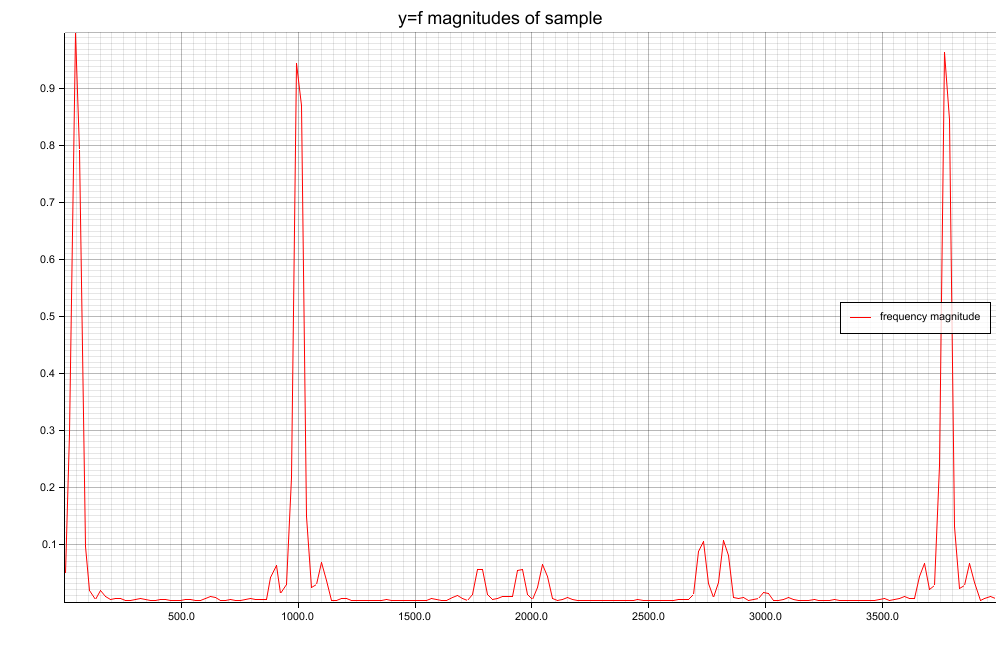
Frequency Spectrum Analysis with FFT in Rust (library spectrum-analyzer)

One week ago FFT (Fast Fourier Transformation) and frequency spectrum analysis were still a mysterium to me. Because I have a long time planned side project (live beat detection to music) and had some time, I started to make a deep dive into digital signal processing (DSP), including lowpass filters and especially frequency spectrum analysis using FFT. I was a little bit shocked/disappointed by the lack of good ressources and easy to understand implementations. Implementations were either absolutly complex and badly documented or way too high level (python, Matlab). I also couldn’t find anything reasonable on crates.io which is some sort of a “basic building blocks” solution that is easy to understand and convenient to use.
I created spectrum-analyzer, a library written in Rust and published on crates.io. I put focus on the KISS principle (keep it simple, stupid) and on good documentation as well as a good performance, no_std-compatibility, and a generally good usability.

How can I get a frequency spectrum from a digital signal?
Let’s assume you read an MP3 file with a sampling rate of 44,1kHz and a resolution of 16 bit. A library like minimp3 will give you an array of 16 bit signed integers, i.e. &[i16]. In order for an FFT to be truly fast, the number of samples must be a power of 2, i.e. 1024, 2048, or 16384, hence let window = &audio_data[0..2048] for example. To reduce noise in the final result and improve signal to noise ratio (SNR) you should apply a window function to the samples. My crate exports a few possible window functions. You can find good ressources about window functions down below, I especially can recommend this video. Examples are Hann window, Hamming window, and Flat Top window. All are suited for different use cases.
Now we have to put the windowed samples into the FFT. But what is FFT?
What is FFT?
FFT (Fast Fourier Transformation) is an algorithm that transforms data from a time-based domain into a frequency-based domain. If we put 2048 samples into the FFT, we get 2048 (complex) results back for example. Only the first half, i.e. 0..N/2, of the FFT results is relevant for this use case. The index in the FFT result, i.e. indices in the slice &fft_result[0..samples.len()/2], corresponds to a given frequency. fft_result[0], i.e. 0Hz, corresponds to the DC component of the signal. fft[samples.len()/2 - 1] corresponds to half of the sampling rate, see Nyquist–Shannon sampling theorem. Assume we give 1024 samples into the FFT, we can calculate all corresponding frequencies as shown below:
  0:   0 * 44100 / 1024 =     0.0 Hz   => DC bias / DC component / Gleichwert (German)
  1:   1 * 44100 / 1024 =    43.1 Hz
  2:   2 * 44100 / 1024 =    86.1 Hz
  3:   3 * 44100 / 1024 =   129.2 Hz
  4: ...
  5: ...
     ...
511: 511 * 44100 / 1024 = 22006.9 Hz
512: 512 * 44100 / 1024 = 22050.0 Hz   => Nyquist frequency
// Note: N/2 is max relevant index!
For example: If the magnitude at index 3 is 1234 and index 3 corresponds to 129.2Hz, then the value of 129.2Hz inside the spectrum is 1234. The snippet above is also explained on stackoverflow.com. To get the amplitude of the frequency, we must get the magnitude of each complex number, i.e. sqrt(re*re + im*im). The more samples we have, the better our frequency resolution is. The frequency resolution/accuracy is:
1/N * sampling_rate; e.g. 2048 samples @ 44100Hz => 21.53Hz frequency resolution/accuracy. You see the frequency resolution in the snippet above. It’s 43.1 Hz there. If the magnitude at index 3 is 1234 and index 3 corresponds to 129.2Hz, then the value of 129.2Hz is 1234.
That’s it basically!
Check out my code on Github. It is as simple as possible with much comments.
Interesting links with further information
- *Especially Recommended!* https://www.gaussianwaves.com/2015/11/interpreting-fft-results-complex-dft-frequency-bins-and-fftshift/
- FFT basic concepts: https://www.youtube.com/watch?v=z7X6jgFnB6Y
- *Especially Recommended!* “The Fundamentals of FFT-Based Signal Analysis and Measurement” https://www.sjsu.edu/people/burford.furman/docs/me120/FFT_tutorial_NI.pdf
- *Especially Recommended!* Fast Fourier Transforms (FFTs) and Windowing: https://www.youtube.com/watch?v=dCeHOf4cJE0
- https://en.wikipedia.org/wiki/Window_function
- Blackman-Harris-7-term window (one possible window function) https://dsp.stackexchange.com/questions/51095/seven-term-blackman-harris-window
- “A family of cosine-sum windows for high-resolution measurements” https://ieeexplore.ieee.org/document/940309
1 Comment
canada drugs online · 2023-03-02 at 21:44
drugs for sale https://www.podcasts.com/canadian-pharmacy-online
Thanks a lot, Lots of data!